2023 Grains, oilseeds and pulses outlook update: Profitability strong despite drop in crop prices
Wednesday, April 26, 2023
Reference: FCC
This is the first quarterly update to our 2023 Outlook for major crops published in January. Over the next two weeks, we’ll update our Outlooks for dairy and cattle and hogs.
Just past halfway in the 22-23 marketing year (MY) for Canada’s cash crops, global and future prices have weakened, softening most of the projected prices since our January outlook. Durum bids have also fallen.
Table 1: Prices ($/tonne) have softened since January, as expected

Sources: Statistics Canada, AAFC, USDA, PDQ, CanFax, CME, MGEX and ICE Futures, and FCC calculations
Marketing Year for corn and soybeans: September 1 – August 31
Marketing Year for wheat, canola, barley, peas and lentils: August 1 – July 31
However, due to a change in our methodology, our previously published outlook estimates and forecasts aren’t directly comparable to these April figures (Table 1). By comparing the two, it appears that prices have risen since January, which is generally not the case. Our former price projections were for specific locations (e.g., Lethbridge barley), while the new methodology projects an average provincial price. This new reporting will also differ from AAFC projections.
With prices softening, FCC Economics projects Eastern crops (winter wheat, corn and soybeans) to remain profitable throughout the outlook period. However, margins per acre will fall considerably YoY and will likely be less than the five-year average. That average was boosted by two excellent years of profitability in 2021 and 2022, when commodity prices were at historic highs and input costs had not yet peaked.
In the West, expected fall revenues will boost strong profitability for canola, durum wheat and red lentils, with yellow peas, barley, and spring wheat margins still positive but closer to break-even. Year-over-year margins will fall in 2023, but only from the last three years of historic highs, and they’ll remain well above the five-year average.
In January, we identified low global supplies and high input costs as two influential factors to monitor in 2023.
Stocks-to-use ratios remain strained
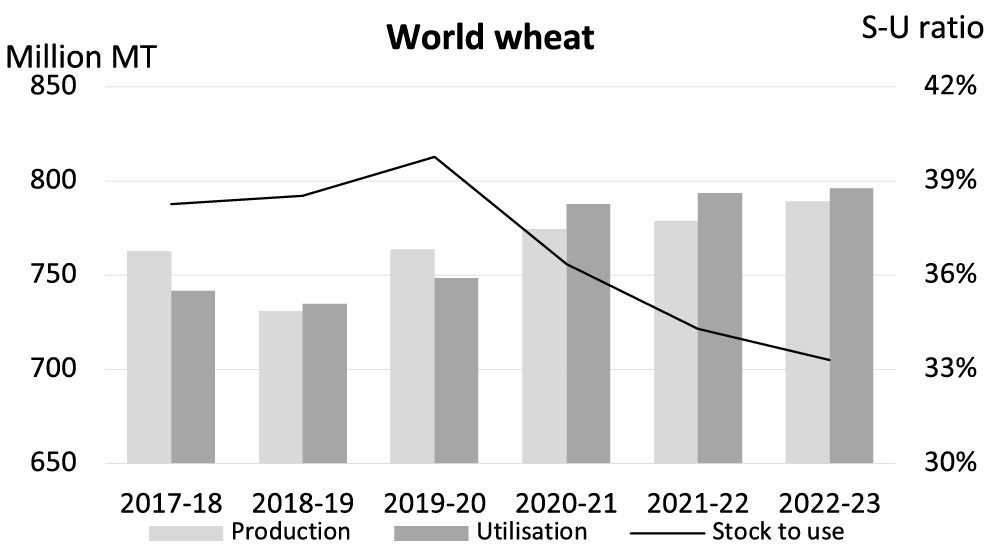
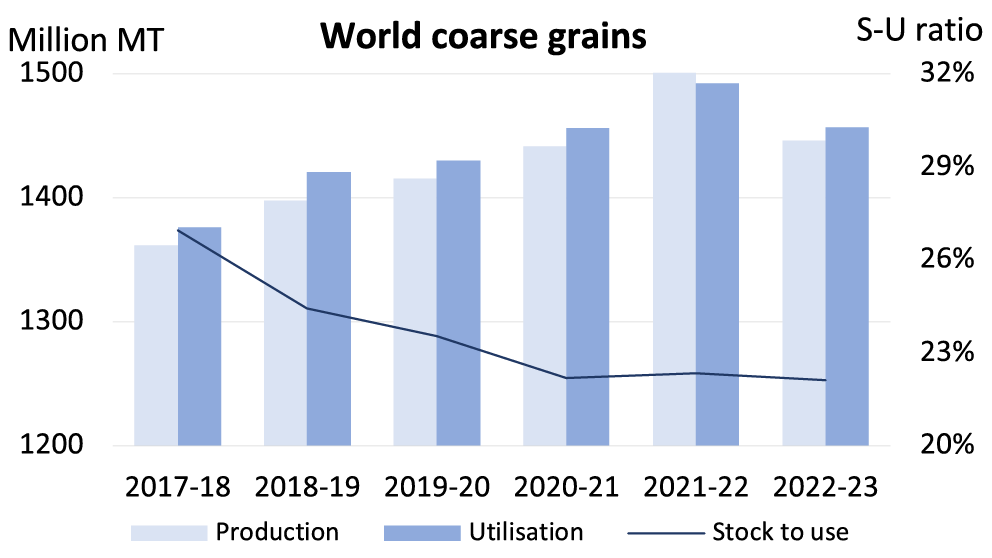
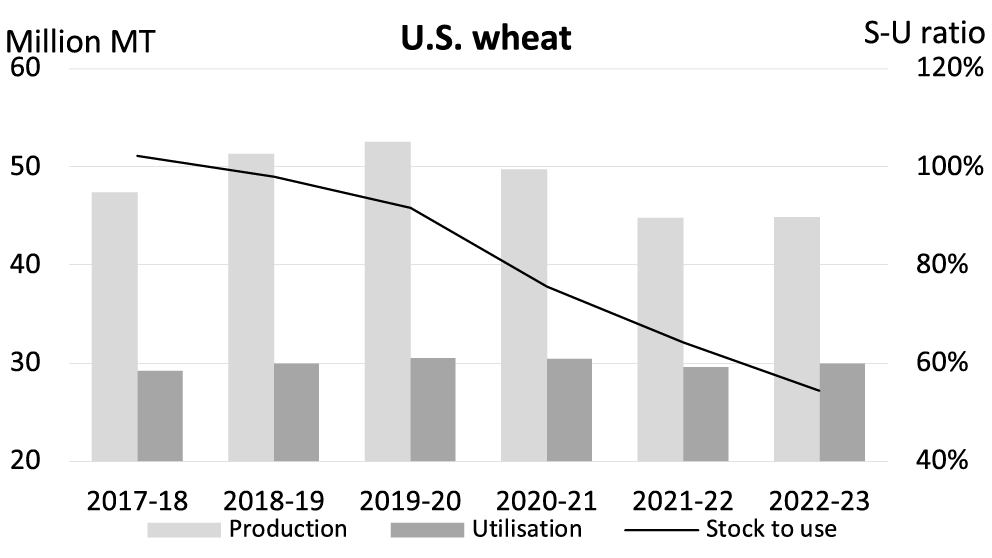
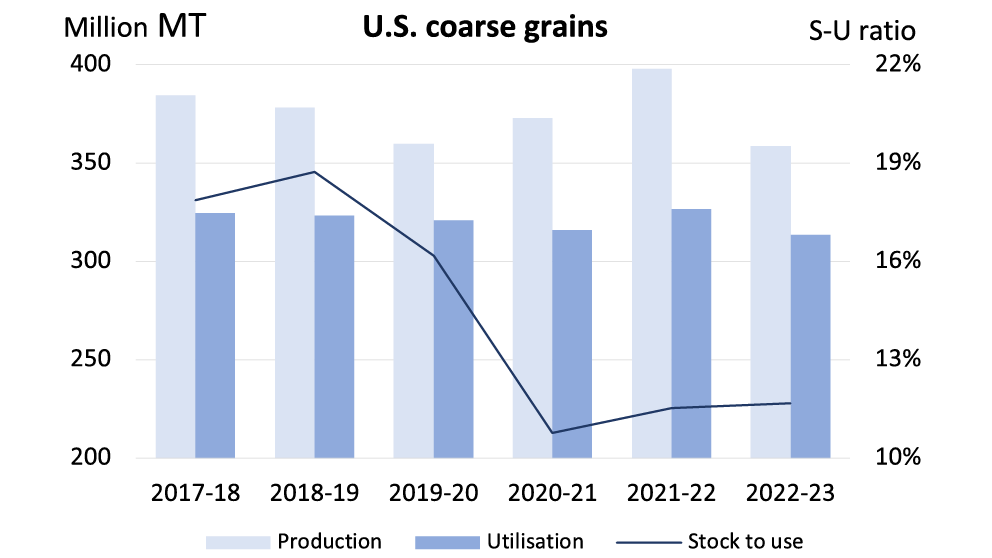
Global wheat production has grown since 2018-19 but has been outpaced by growth in demand which has pressured its stocks-to-use ratio up to April (Figure 1). And while global coarse grain production grew more year-over-year (YoY) than utilization in 2021-22, the war in Ukraine and drought conditions elsewhere limited production in 2022-23, dropping it more than utilization fell YoY. The upshot? World stocks-to-use ratios for the two commodities remain the lowest in the last six years and have not yet reversed the downward trend as we suggested they might – but their falls appear to have slowed. Any further strengthening of the ratio will indicate pressured commodity prices.Figure 1: Strong global demand for crops drops ratios; U.S. ratios burdened by production losses in 21-22 nd 22-23
Source: WASDE
A sharp YoY decline in the 2021-22 MY U.S. wheat production helped speed the decline in its stock-to-use ratio, given that utilization didn’t fall as much. This crop year’s ratio to date hasn’t slowed. The ratio for U.S. coarse grains fell to its lowest point in the 2020-21 MY. It’s trended higher since, based on excellent YoY production growth in 2021-22 and falling utilization in 2022-23.
The biggest unknown is whether Russia will extend the UN-brokered Black Sea deal to facilitate the movement of grains and other commodities from Ukraine as we head into spring. Recent discussions with Moscow have clouded optimism that the deal, set to expire May 18, will be re-signed. What is known in world markets is the impact of Argentina’s historic drought. Mid-April estimates pegged the country’s soy production at 23 million tonnes, 53% lower than initial projections, and corn production at 32 million tonnes, or 40% of the original forecasts. Global soy markets remain very tight.
Fertilizer prices set to offer relief after abnormal highs
U.S. fertilizer prices have declined rapidly in the last few months. European natural gas prices (the key feedstock in nitrogen fertilizer) are again aligned to historical trends after supply boosts last autumn and a well-timed warm winter. European fertilizer production capacity idled during the pricing crisis and has returned online, boosted by lower natural gas prices. At a time when overall commodity prices have also declined, we examined the relative differences in the price changes of crops and fertilizers (a crop-to-fertilizer price ratio) to get a rough sense of fertilizer affordability per crop. A higher ratio indicates better fertilizer affordability. Large spikes in 2021 show the impact of that year’s drought that propped up crop prices. The subsequent sharp decline in the ratio reflects the impacts of rapidly rising fertilizer prices.
FCC Economics is projecting continual declines in fertilizer and commodity prices throughout 2023 (Table 2). However, because commodity prices won’t fall to the same extent as fertilizer prices, we see the crop-to-fertilizer price ratio improving throughout 2023. Nitrogen prices may fall even further in June/July if two million acres of corn, the USDA’s March 31 seeded acreage report’s swing acres, aren’t planted this spring. Conversely, producers who bought this year’s fertilizer in the fall of 2022 (at high prices) but didn’t sell their crops when commodity prices were high may deepen the ratio further.
Table 2: Farm input prices to ease in 2023 as supply-demand balance regains stability
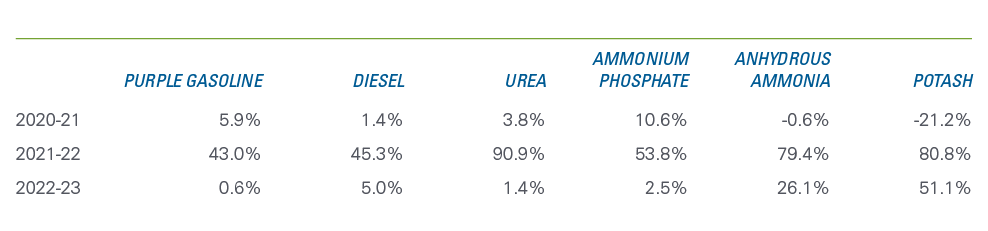
Sources: Alberta Farm Inputs, World Bank, FCC calculations (* rolling average)